The novel coronavirus, named SARS-CoV-2, has been spreading throughout the world for several months now. It emerged in China, most likely in December 2019. After just 4 months it is now (April 2020) infecting people in most countries in the world.
Many of us follow news about its progression and we observe the growing sick numbers with increasing anxiety. And we feel helpless. Most of us only see the epidemic’s indirect effects and the rest is just media buzz. Our coronavirus simulation attempts to explain everyone, using simple means, what is happening accross the world right now. It can show – in a limited way, as it is only a simulation – how our and our governments actions in the following weeks can influence the spread of the virus.
What our coronavirus simulation does
We attempt to simulate the dynamics of human-to-human interaction and the viral infections that occur because of them. While such processes are relatively easy to model mathematically, especially for very large numbers, they do not allow us to see the process itself.
In our simulation the subjects of the epidemic are balls in 2-diemensional space. They move at a constant speed and bounce off each other. Each bounce is contact and a possible spread of the coronavirus. While this model is simple, in a way it does a good job of representing the real life, where, similarily, each human-to-human contact, random or not, may result in an infection.
You can see the simulator running in the recordings below. You can also download and run it yourself – instructions are near the end of the article.
Simulation parameters
Parameters of the disease (duration, symptoms intensity, death rate) in our simulation were set according to current medical data. Around 6 days of asymptomatic transmission and then, depending on disease severity, a few weeks to recovery (or death). Severe cases are modeled to last longer than mild, though some severe cases, especially those with no access to virtual hospitals for balls, die quickly. All durations are gauss-randomized with the mean at the center of the distibution.
The mortality is mostly unknown as of right now. For the purpose of this simulation we assumed 1% mortality rate for people who need and receive hospital care and 10% for those that need it and don’t receive it. We sincerely hope that the real numbers are much, much lower. For demonstration purposes however, such values help show the importance of flattening the curve.
The population of balls in our simulation is 2000. There are 10 spots for sick balls in our virtual simulation, which is 0.5% of the population. That’s a relatively high value – in real life it’s closer to 0.02-0.05%. On the other hand, many people could be sick without symptoms, so the required hospital capacity may be proportionally lower than we estimate. We don’t know that as of right now, so our parameters may not precisely describe the real-world situation.
Please remember, that our cornavirus simulation is not a statistical model – it’s a randomized, simplified example of how the virus can spread. Therefore, running the same simulation multiple times with the same parameters may – or actually: must – give different results. Statistically, however, they will be similar.
Since our model is so imprecise, since we’ve made so many assumptions, what’s the point of making and describing the simulation? We want to show everyone that the actions we are all taking to slow the spread of the novel coronavirus and Covid-19 sickness do have a real impact. And that impact can be clearly seen in the simple simulation of bouncing balls. See for yourself!
How do we slow the coronavirus down?
There are many measures that can be taken by governments and people themselves. In our coronavirus simulation we modeled a few of them. The following countermeasures are available in our application:
- social distancing – keeping a safe distance from other people, evading people showing symptoms, reducing interactions with other people by people showin symptoms; choosing this option reduces the spread probability on contact four times
- quarantine on symptoms – if a ball notices it is sick, it will stop moving and spreading the disease
- voluntary quarantine – 20% of population is quarantined from the very beginning, does not move and can not catch or spread the disease
- contact tracing – if one ball shows symptoms, then after one day all balls it was in contact with are quarantined and can not catch or spread the disease
- schools closed – reduces the speed of balls by 50%, thus significantly reducing the number of interactions between balls
… Let’s see how the coronavirus simulation works
For starters, let’s just
Run the simulation with no countermeasures
The virus spreads astonishingly quickly.
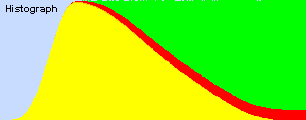
Coronavirus simulation – no countermeasures.
The picture above is a histogram of the epidemic. One column of pixels is one data sample, which shows the state of 100% of the population in a given moment. Time flows from left to right. Colours show the health state of the population – yellow are sick, red are deceased, green are recovered. Blue color is for those who never had the virus. The width of the picture matters – the wider it is, the longer the epidemic lasted.
What can you see in that picture? A very quick, exponential growth of sick people. In just 10 days 100% of the population got sick. Because Covid-19 takes a long time to cure, almost the entire population is sick before there are first recoveries. On the other hand, since almost everyone got sick very quickly, the epidemic lasted for only 40 days, and after 30 days only a few balls remained sick.
Since the spread was so quick, the hospitals got full very early. Lots of balls did not get the help they needed, and the death count was significant, finally reaching almost 10%, which is close to the maximum (statistically) possible value. In short, hospitals were full, people who could’ve been saved – died.
Let’s see how the coronavirus fares with the countermeasures currently implemented in many countries across the world. Namely:
Closed schools and social distancing
The spread of the virus looks like this:
And here’s the histogram:
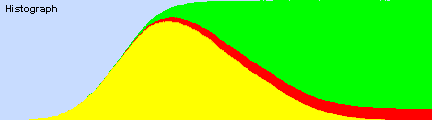
Coronavirus simulation – social distancing and schools closed
100% of the population got sick, but the maximum number of sick was 80% of the population, compared to nearly 100% with no countermeasures. It took 21 days to reach the peak of the epidemic, which is over two times the duration for no countermeasures at all. The curve is flattened significantly. Epidemic lasted for 65 days. Health care system was overwhelmed, but not as tragically as with no countermeasures. As a result, the death rate was 8.5% compared to almost 10% in the first scenario. For a population of 100 million this means 1.5 million people saved. That is a lot!
How about a different set of countermeasures? Social distancing seems to be the most important[1][2], so let’s pick it.
Along with social distancing – self isolation on symptoms and active contacts tracing
Here’s how the simulation looks:
And that’s how its histogram looks:
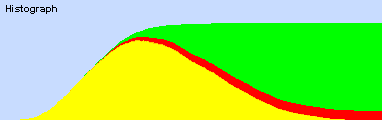
Coronavirus simulation – quarantine on symptoms and contact tracing.
In this simulation around 80% of the population got infected. It is less than in previous scenarios (where eventually 100% got infected). The peak of epidemic was on day 16 and the epidemic lasted 56 days. Less balls died – 7.25%. The reduced number is correlated with the reduced number of infected. Countrmeasures allowed some balls to not catch the diseas at all, and becase of that they were not in the risk of dying and the health care was less overwhelmed.
Interestingly, of the model in our simulation with the quarantine option had a side effect. Virtual barriers, made of non-moving qurantined-balls started ocurring. This significantly reduced the mobility of other balls, including those that were sick. Whether real-life quarantines have similar effect, we do not know. Physically – no, but statistically – it could have similar effect.
Finally – let’s see what happens when we use
All available countermeasures
The coronavirus spread in our simulation looks like this:
And the histogram is as follows.
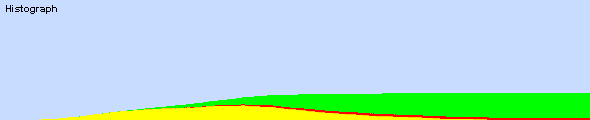
Coronavirus simulation – all countermeasures active!
Yes, there, at the bottom of the graph, are the infected. The rest of the population never caught the virus. This time the simulation results were very positive. Only 22% of the population got sick and the health care was not significantly overwhelmed. The peak of the epidemic was on the 30th day and the epidemic lasted for over 73 days. Mortality was 1.75%, which is 8.25% less (or, in other words, over 5 times less) than with no countermeasures.
See it for yourself!
Our simulator is available for download here. It requires Java to run (available for download here).
On windows just double-click the jar file. On linux you can use java -jar coronavirusSim.jar command to run it.
We encourage you to experiment with the application and available coutnermeasures. Share your thoughts on our twitter @PretiusSoftware or author’s twitter, @VaverDariush.
Summing up
Our simulation showed how the SARS-CoV-2 can spread across the population and how different countermeasures can affect how it spreads.
Social distancing and closing shools significantly slowed the spread, but eventually the whole population got infected.
Social distancing, self-isolation of the sick and sick contact tracing also slowed the virus. Despite that, most of the population got infected.
All sets of countermeasures had positive effect. However, only using them all at once allowed most of the population to remain healthy.
What can we do then? Both not much and a lot. How to stop the spread? By taking countermeasures, which, for a normal person, usually means to not do anything special – stay at home, wear mask or cover your face when you have to get out. And, most importantly, start social distancing, even isolate yourself.
The more we do, the more countermeasures we use, the better the results and the more people are saved.